Pricing Models
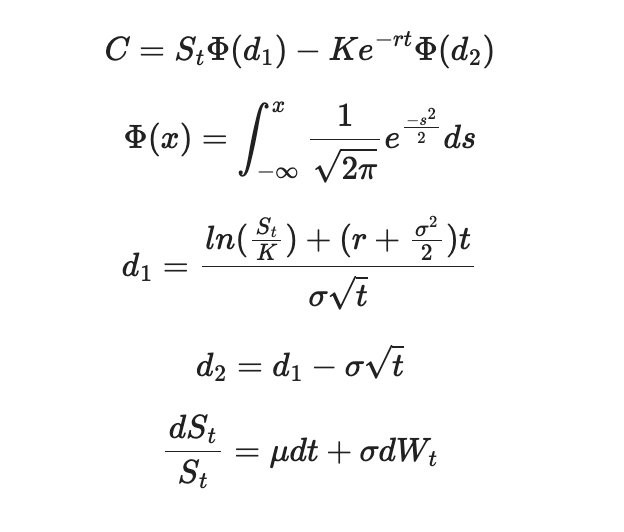
We simulate millions of potential option outcomes using advanced quantitative models based on the Black-Scholes framework and Monte Carlo simulation techniques. Rather than assuming that stock prices move along a predictable path, our models recognize that financial markets are inherently uncertain and influenced by countless variables ranging from earnings reports and economic data to investor sentiment and market liquidity.
To account for this uncertainty, we model asset prices using Geometric Brownian Motion (GBM), a stochastic process widely used in quantitative finance. GBM assumes that stock prices evolve through a combination of expected returns and random market fluctuations, producing realistic price paths that reflect the probabilistic nature of financial markets.
By generating millions of simulated future price scenarios, we can estimate the probability distribution of an option's value at expiration and throughout its life cycle. This allows us to evaluate potential returns, downside risks, expected volatility, and the likelihood of specific price targets being reached under varying market conditions.
The resulting analysis provides traders with far more than a single theoretical price. Instead, it offers a comprehensive view of possible outcomes, confidence intervals, risk metrics, and probability-weighted expectations. This enables more informed decision-making, improved risk management, and the identification of opportunities where market prices may diverge from statistically derived fair values.
Through large-scale computational modeling, we transform raw market data into actionable insights, helping our traders make disciplined, evidence-based decisions in complex and rapidly changing markets.
"The Trillion Dollar Equation"
Fibonacci Ratios
Divide any of the Fibonacci numbers by the next higher number. After 3, the answer is always 0.625. After 89, the answer is always 0.618; after higher numbers, more decimal places can be filled in. Divide any number by its preceding number. After 2, the answer is always 1.6. After 144, the answer is always 1.618.
The Greeks knew this proportion and called it "the golden mean." The golden mean also appears throughout nature-in flower patterns, the leaves of an artichoke, and the leaf stubs on a palm tree. It is also the ratio of the length of the human body above the navel to its length below the navel (in normally proportioned people, that is). The length of each successive bone in our fingers, from tip to hand, also bears this ratio. The horizontal member of the Cross separates the vertical member by just about the same ratio: the length above the crosspiece is 61.8%
of the length below it. In one of its more romantic manifestations, the Fibonacci ratio defines the proportions and shape of a beautiful spiral that appears in the shape of certain galaxies, in a ram's horn, in many seashells, and in the coil of the ocean waves that surfers ride. The structure maintains its form without change as it is made larger and larger and regardless of the size of the initial square with which the process is launched: form is independent of growth.
The journalist William Hoffer has remarked, "The great golden spiral seems to be nature's way of building quantity without sacrificing quality." The Fibonacci numbers can be used to make a wide variety of predictions, especially predictions about the stock market. Since 1962, Fibonacci's Liber Abaci was a spectacular first step in making measurement the key factor in the taming of risk.
Bernstein, Peter L. Against the Gods : The Remarkable Story of Risk. New York, John Wiley & Sons, 1996.
Luxsolis Investments uses Fibonacci ratios to identify patterns. Fibonacci retracements are horizontal levels drawn on a chart to indicate possible support or resistance zones where price might reverse during a pullback. Fibonacci extensions are levels beyond 100% that help traders estimate where price might go after a breakout or trend continuation.
Retracements
- 0.236 (23.6%)
- 0.382 (38.2%)
- 0.500 (50%)
- 0.618 (61.8%) ← the “Golden Ratio”
- 0.786 (78.6%)
Extensions
- 1.272 (127.2%)
- 1.618 (161.8%)
- 2.000 (200%)
- 2.618 (261.8%)
Fibonacci ratios are useful for setting up entry and exit points. By using these levels, quant trading is simple, allowing a trader to lock in profits by sticking to a numerical framework that removes the element of fear and greed from the equation.
Quantitative Research & Algorithm Development
At Luxsolis Investments, quantitative research sits at the center of our investment process. We develop proprietary algorithms, statistical models, and automated trading systems designed to identify opportunities, improve execution quality, and support data-driven decision making across multiple asset classes.
Martingale-Based Mean Reversion Framework
Our research team has developed a systematic mean reversion strategy that focuses on seasonally strong equities trading below their estimated intrinsic value. The model identifies securities exhibiting historically recurring seasonal strength and enters positions at predetermined pullback levels when prices deviate from expected value ranges.
Rather than relying on a single entry point, the algorithm scales into positions through a structured five-level accumulation framework. This approach allows capital deployment to occur incrementally as prices become increasingly attractive, improving average entry prices while maintaining disciplined risk controls. The system continuously monitors valuation metrics, historical seasonality patterns, liquidity conditions, and market volatility to determine optimal position sizing and deployment schedules.
Options Chain Analytics & Pricing Inefficiency Detection
We have developed an automated due diligence engine that continuously parses and analyzes options chains across thousands of securities. The platform evaluates implied volatility, open interest, volume dynamics, bid-ask spreads, and Greeks to identify potentially mispriced contracts.
The system integrates quantitative pricing models, including Black-Scholes and related derivatives valuation frameworks, to compare theoretical option values against prevailing market prices. When statistically significant pricing discrepancies are detected, the platform generates actionable trade recommendations for review by traders.
By automating data collection, valuation calculations, and opportunity screening, the process significantly reduces research time while helping minimize execution delays and slippage. This allows traders to focus on higher-level portfolio decisions rather than manual option pricing calculations.
Predictive Machine Learning Research
Our quantitative research team develops predictive machine learning models using extensive historical market data, alternative datasets, and macroeconomic indicators. These models are designed to identify patterns that may provide insight into future price movements, volatility regimes, and market behavior.
Model development includes rigorous backtesting, cross-validation, feature engineering, and statistical significance testing. Rather than producing single-point forecasts, our models generate probabilistic outcomes and confidence intervals that help quantify uncertainty and support risk-adjusted decision making.
Research efforts span multiple machine learning methodologies, including regression models, ensemble techniques, time-series forecasting systems, and advanced pattern recognition algorithms. The objective is not to predict markets with certainty, but to systematically improve the probability of making informed investment decisions.
Autonomous Trading System Development
We develop custom software directly within trading and brokerage platforms to automate execution workflows and portfolio management processes. These systems monitor market conditions in real time and can automatically execute orders when predefined criteria are satisfied.
Automation capabilities include limit-order deployment, position management, risk controls, portfolio rebalancing, and event-driven execution strategies. By removing manual intervention from routine trading activities, these systems improve consistency, eliminate emotional decision making, and ensure that trading plans are executed exactly as designed.
Our long-term objective is the development of fully autonomous trading infrastructure capable of monitoring markets, evaluating opportunities, managing risk parameters, and executing strategies with minimal human oversight while maintaining strict compliance and risk management standards.